Distributed Tracing with AWS X-Ray: P1 - Introduction
Hello everyone. Welcome to the first part of distributed tracing with AWS XRay.
In this part, we are going to implement distributed tracing with X-Ray in a relatively complicated web application. I will be providing all of the required repositories, reference templates and screenshots to guide you through this process.
Background#
Let me tell you a story. You have a web application written in ExpressJS and you have that deployed in AWS ECS and it communicates with RDS. The days were going good - but one day the QA team reports to you that some of the API endpoints are failing.
You need to figure out what the reason is. So, you check AWS Cloudwatch Logs and quickly figure out what is the reason. You can even check Application Load Balancer logs to find out which requests are failing to better understand the nature of the request.
Let’s complicate this application a little bit.
You have a web application written in ExpressJS that uses microservices architecture. There is an API Gateway running in ECS, an authentication service, an order management service and one payment processing service. The days were going good as well - but one day the QA team reports to you some of the requests are failing.
Now it’s significantly hard to debug the traditional way. You can’t be checking the logs of multiple services because not all the services receive request at the same time and you cannot deterministically say which path the request followed.
Maybe it went first to authentication service and then to order management service and payment or any other way? This is a very common problem in microservices architecture.
Only if there was a way to trace the request path.
How can we achieve this? Let’s brainstorm some solutions.
Maybe the problem is decentralized log aggregation. If we had all the logs aggregated in one place we could get better sense of the reason the errors. But wait - there’s a problem with this approach. How can you correlate the requests sent between microservices as one single entity? What is the correlation identifier?
We can generate that correlation ID, easy. But how do you propagate that between services? Since most of the web applications communicate over HTTP, we can use HTTP headers for the propagation. Let’s say we correlate requests with userid. We can add headers like X-Request-UserID=1. Now, when any service receives request with this header, it will do the work and pass this header to all other microservices it calls. If we implement good enough logging, this is very important step in the right direction.
Distributed Tracing#
So, the gist is we need a full end to end request’s journey from which it enters the system and when it receives a response. This helps developers to pinpoint the exact location of errors and performance issues. Distributed tracing is a observaibility technique that is used exactly for this purpose.
How it works?#
Each unit of work that we want to identify is called span. An API call can be a span, a database query can be a span, a HTTP call can be a span. Span can have metadata associated with it. For example: A span of API request can have statusCode, requestLatency, contentType etc. This is also known as context. The collection of span is known as trace. When a request enters the system, we assign it a unique trace ID. This ID is passed along with the every request it makes to other services.
This process is known as context propagation.
Look how the span ID keeps changing but the TraceID stays same. This is how we define the path. The Span ID increments by a fixed unit (in this case, but think of them as a parent-child relationship) which gives us exact path, retries etc between microservices.
Now let’s go back to the original problem we had thought of. If we had defined proper spans when services communicate with each other, we could easily pinpoint the exact issue. The spans might have metadata such as responseCode, timeout etc.
Now this sounds like a lot of work. Imagine creating all these spans, visualizations, decorating all HTTP calls, database queries, adding metadata. While creating all these spans manually is a nightmare, services like AWS X-Ray take care of this for us.
AWS X-Ray#
This is where AWS X-Ray comes in. AWS X-Ray is a service specifically designed for debugging distributed applications. It collects data from your components and gives a detailed map of how service are connected and where errors and performance bottle necks exist.
Automatic Instrumentation#
One of the most significant benefit is the automatic instrumentation provided by AWS X-Ray. You don’t need to create each and every span by yourself. There are agents and SDKs that can automatically capture data for common operations like HTTP requests, database calls and AWS SDK calls. The complex part of the puzzle is solved by X-Ray’s instrumentations.
- SDK automatically generates trace IDs for each incoming request and span ID for each unit of work.
- It automatically propagates the context to downstream services using standard HTTP headers which is
X-Amzn-Trace-ID. - It automatically captures key metadata such as
service-name,durationand any HTTP status codes.
Once it collects all the data, it provides us with a service map that provides a visual representation of different services and how they communicate.
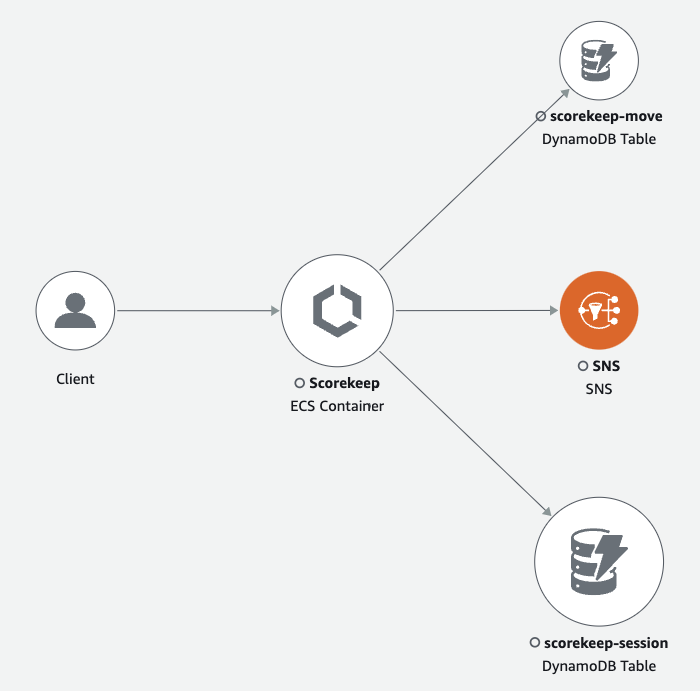 Figure: AWS X-Ray Service Map
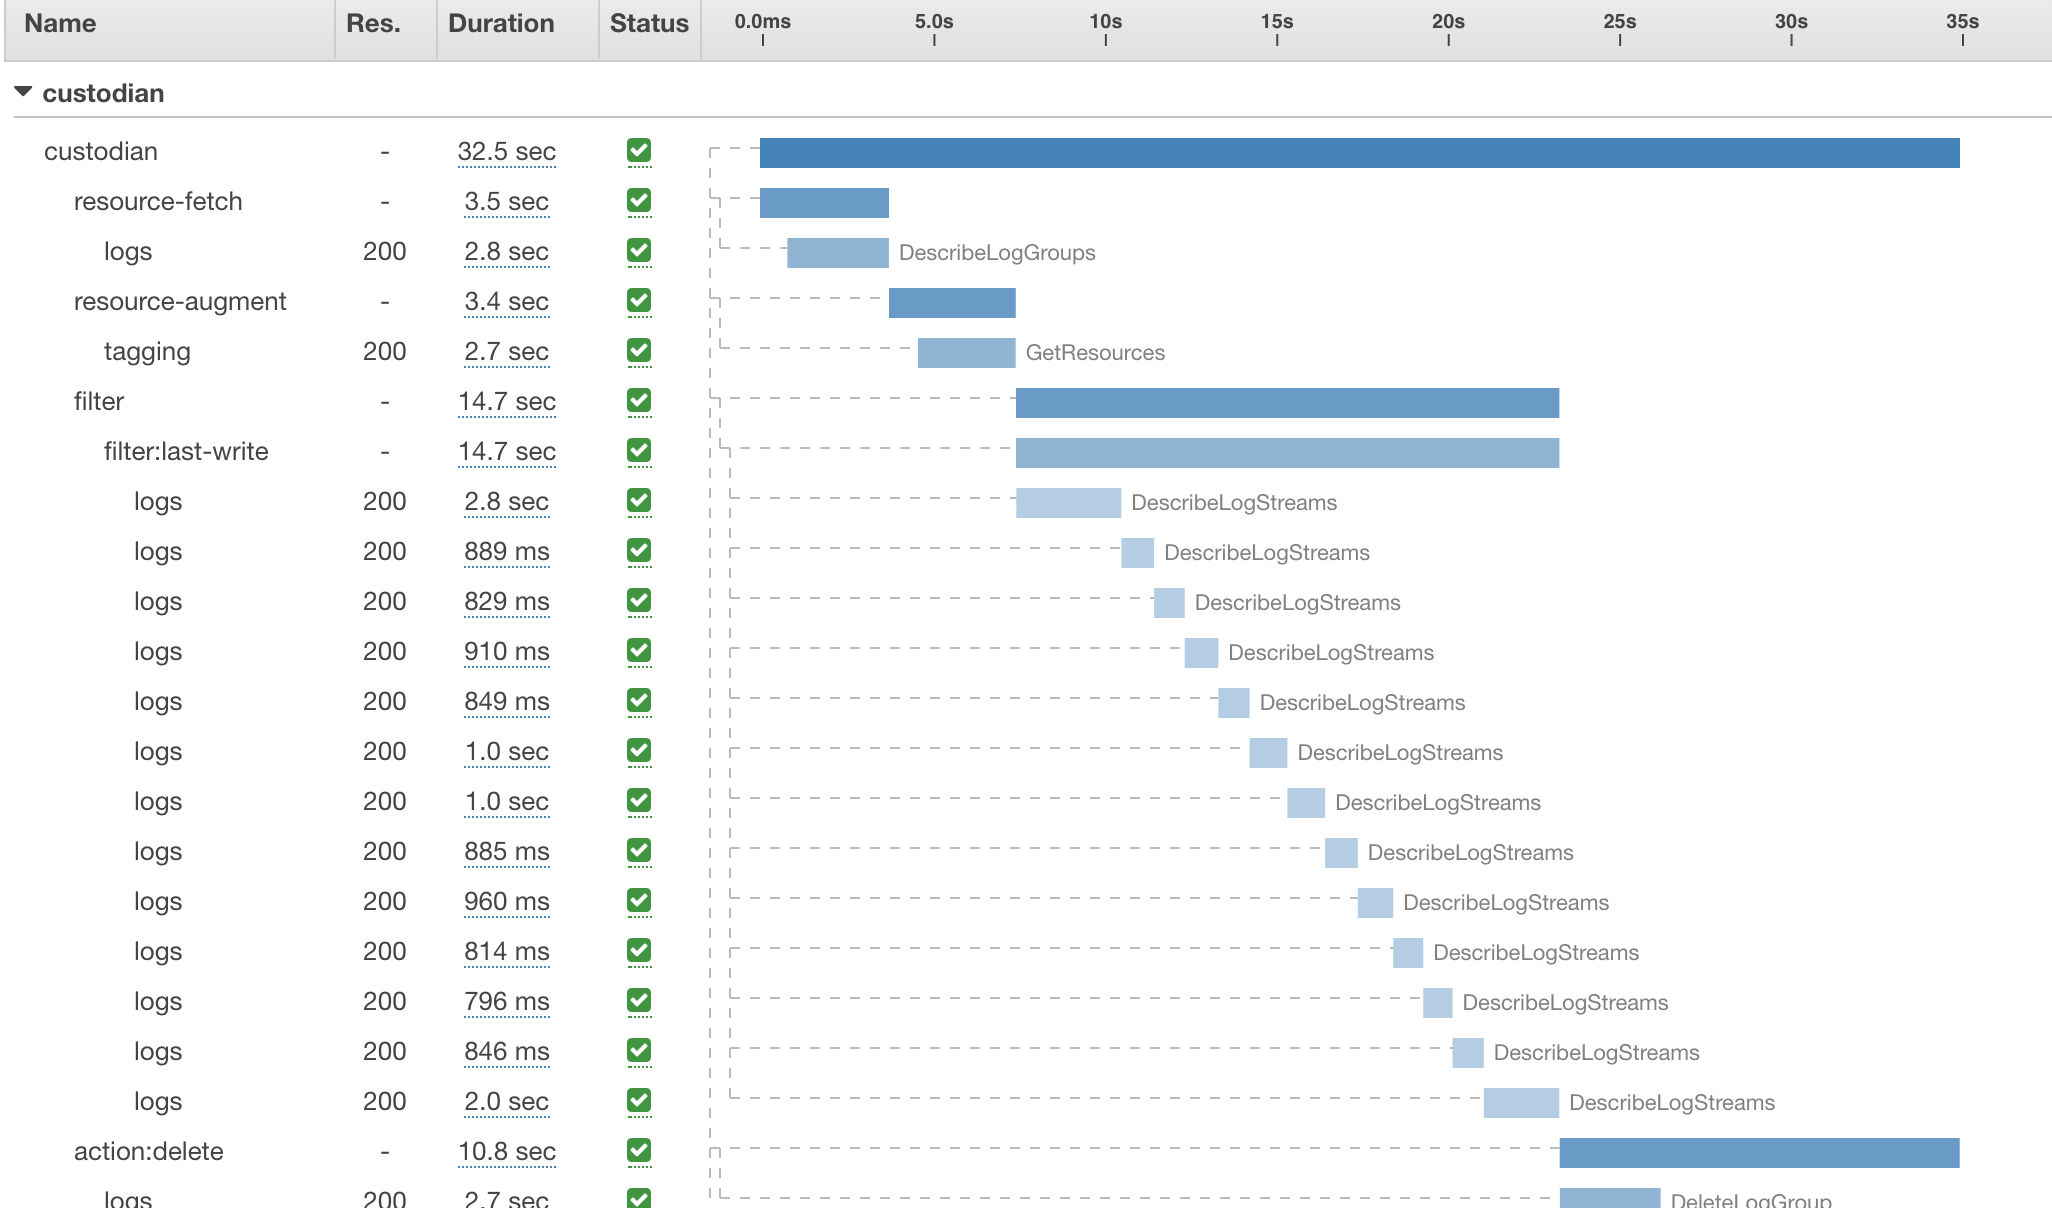 Figure: AWS X-Ray Trace
In the next part of this blog, we will look into how we can integrate AWS X-Ray in a NestJS application.